

In this collection of Search Engine Optimisation (SEO) stats, we look at some key data on search trends and the market share of major search engines.
I’m looking at this from an ecommerce perspective, with SEO being a key search channel for most online retailers. For example, the importance of ranking well is shown by the CTR stats here.
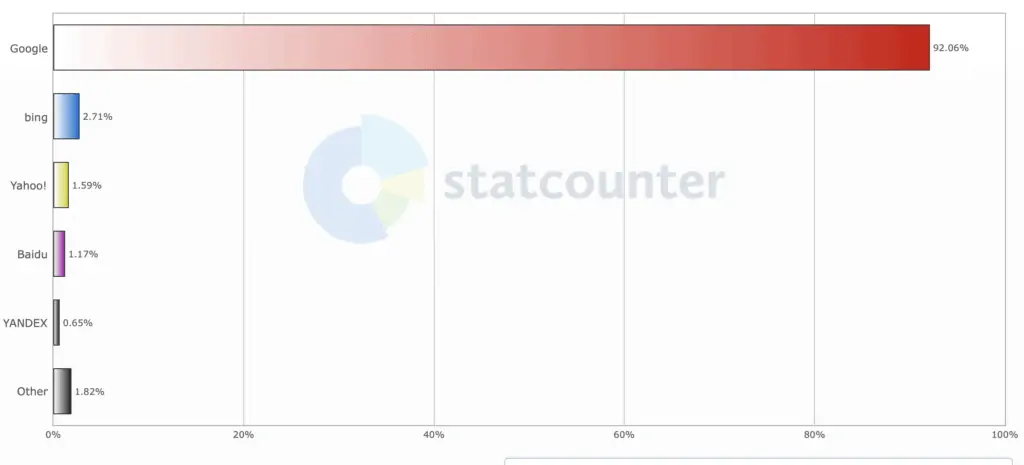
Google dominates the global search market, accounting for 92.06% of all searches worldwide.
Bing is next with 2.71%, followed by Yahoo on 1.59%, Baidu on 1.17%, and Yandex on 0.65%.
In the UK, Google dominates, though Bing takes a bigger share than it does worldwide.
New ‘challenger’ search engines like DuckDuckGo and Ecosia are growing though. DuckDuckGo grew by 62% in 2020, while green search engine Ecosia has more than 1.5m users in the UK.
- Google – 93.31%
- Bing – 4.25%
- Yahoo – 1.25%
- DuckDuckGo – 0.69%
- Ecosia – 0.33%
- Yandex RU – 0.04%
2.The Importance of Search for Website Traffic
On average, organic search accounts for 53% of traffic to websites, making it the primary channel for many sites.
In combination with PPC, search traffic accounts for 62% of all trackable website traffic, according to BrightEdge.
3.How Search Ranking Affects Click Through Rates (CTR)
The importance of ranking as highly as possible is underlined by stats from Advanced Web Ranking.
The first position on Google has a 34.19% click through rate, second place is 14.07%, third 9.03% and fourth 5.99%. If a result is one page two, it attracts an average CTR of 1.2% or less.
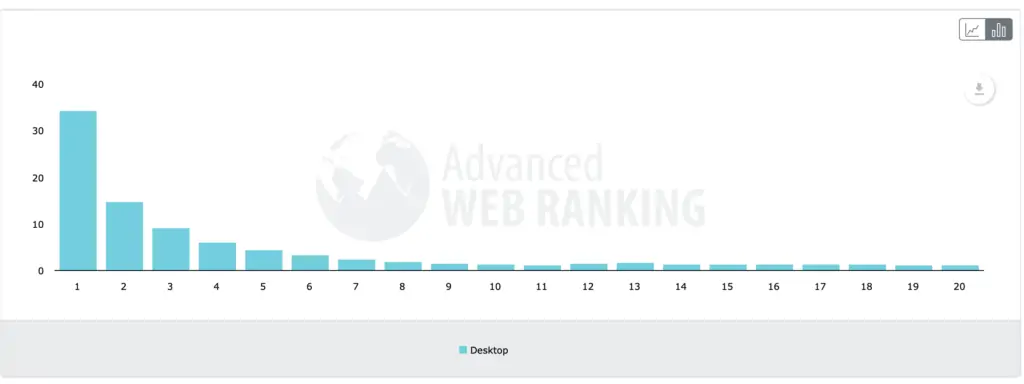
The chart above shows results where only organic results appear. When SERP features are shown – things like video results, answer cards and featured snippets – the CTR decreases.
For example, the addition of video results pulls the CTR of the top result down below 30%, and tends to push the CTR of the organic results just below videos even further, as they become less visible to searchers.
4.Growth in Ecommerce Search Demand During 2020
The COVID-19 pandemic pushed shoppers online as lockdowns forced many retail outlets to close their physical locations.
Stats on search volumes for different retail sectors reveal how demand has grown over time, with unprecedented peaks in consumer demand across several retail sectors.
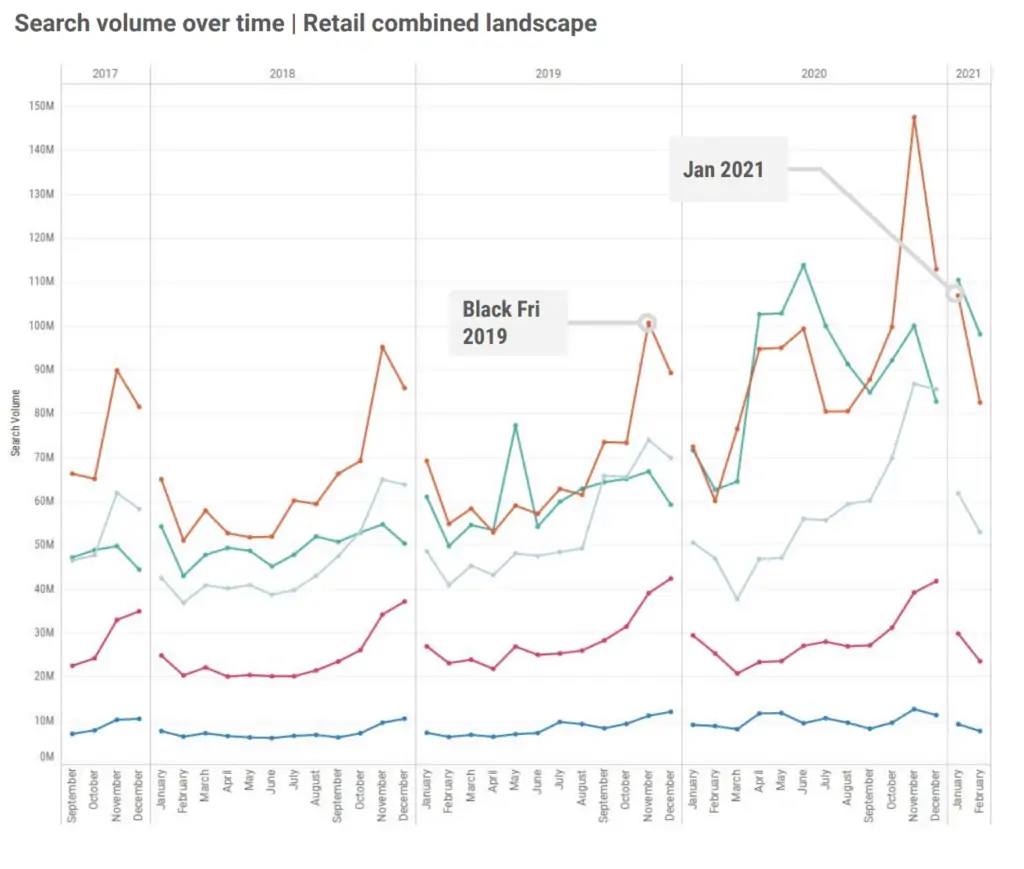
Of the five retail sectors tracked by Pi Datametrics, some have experienced huge peaks in demand during 2020.
Homeware and electrical were in huge demand, with demand for homeware peaking in June 2020, driven in part by demand for garden and DIY products during lockdown. For example, search volumes for products like garden furniture and hot tubs were more than 200% higher than in 2019.
Demand for electrical was driven by home entertainment products, with games consoles being the most popular single products.
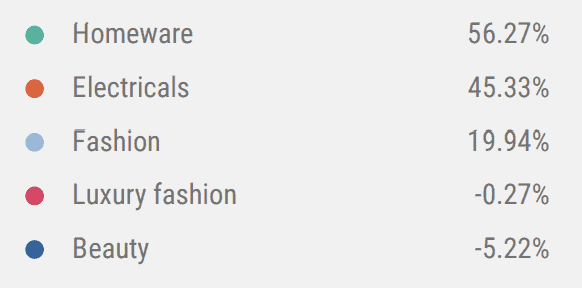
Year on year, homeware search volume grew by 56.27%, followed by electricals on 45.33%. However, the beauty and luxury fashion sectors experienced drops in demand as people were less likely to go out and socialise.
5. Local Search
46% of searches on Google are from users looking for local information, while 72% of shoppers that perform a local search subsequently visit a store within five miles.
Mobile can be even more important from a local search perspective, as 88% of people who search for local businesses on a mobile device contact the business within 24 hours.
It’s vital to optimise for mobile searchers though, as 61% of shoppers are more likely to visit or call if the business has a mobile-friendly website.
6. Where Shoppers Begin Product Searches
Several studies have found that product searches are more likely to begin on Amazon than Google, a stat that underlines the dominance of Jeff Bezos over online retail.
- An Adeptmind survey in 2018 found that 46.7% of US web users began searching for products on Amazon, compared with 34.6% on Google.
- A Salsify survey from the same year found 41% started on Amazon and 28% in Google.
However, the same survey found that shoppers searching on Amazon took longer to make a purchase (25.9 days) than those beginning product searches on Google (19.6 days).