In this collection of ecommerce stats, we look at email ROI, stats by sector, deliverability, and the devices people use to open emails.
1. Email marketing ROI
Email has consistently delivered one of the highest returns of any marketing channel, if not the highest.
According to the DMA’s Marketer Email Tracker 2020, marketers report an average return of £35.41 for every £1 spent on email marketing.
Large businesses were more likely to see higher returns, £44.08 on average, than SMEs, which averaged £30.61.
2. When should you send emails?
This is really one of those ‘it depends’ questions as there are so many variables – the type of business, seasonal trends, weather, and so on.
The type of email is another factor, and these stats from Omnisend refer to newsletters sent by retailers – the kinds of emails that users sign up to to receive product updates, news on promotions etc.
The beginning of the month is the best time to send according to research, with the first two weeks performing better than the second half of the month.
The best days are the 5th, 12th and 7th, though 25th and 27th perform well too, which suggests a correlation with pay dates.
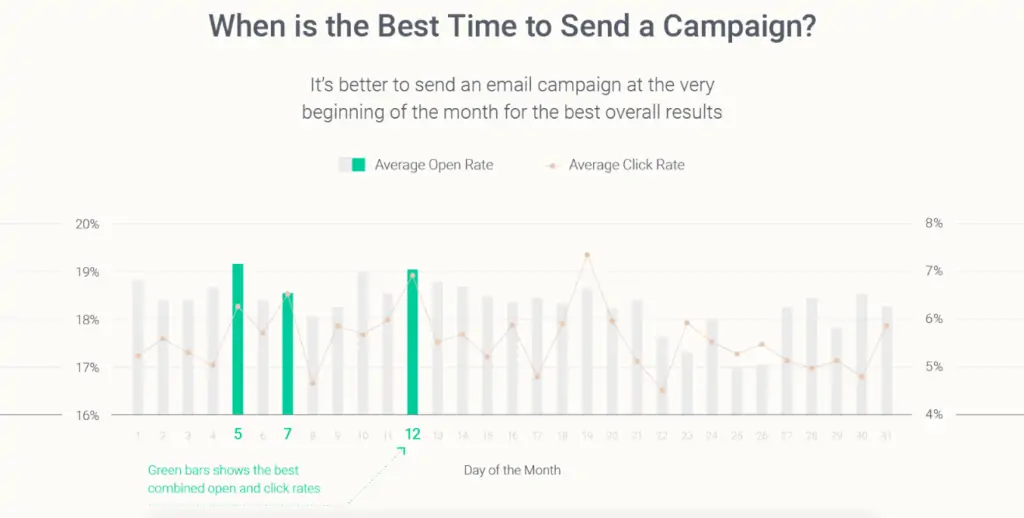
The research also looked into the best days to send emails, with Thursday coming on top, followed by Tuesday and Wednesday. Indeed, there is a consensus amongst studies like this on midweek sending. It’s also often advised to avoid Mondays.
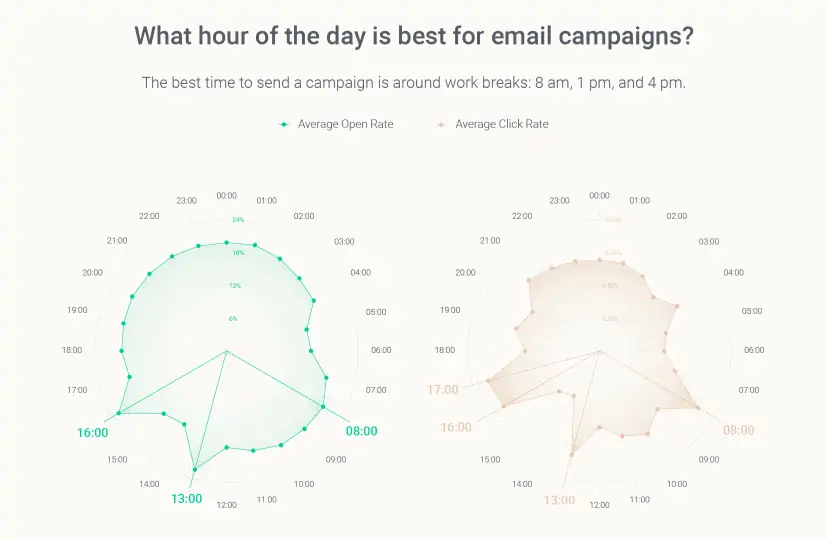
The best times vary according to the email metric:
- 8am is the best time of day in terms of open rates.
- The best performing time for click through rates was 5pm.
- 4pm was the best time in terms of order rates.
- Taking the various metrics into account, the best overall time is 1pm.
So, 1pm on a Thursday during the first ten days of the month is when you should send your emails. Of course, you need to find your own best time, but this can at least provide a starting point for you.
3. Email open and click rates by sector
Not all emails perform alike – there can be a lot of variance between sectors and types of email, but it can sometimes be useful to use stats to give you something to compare your own data to.
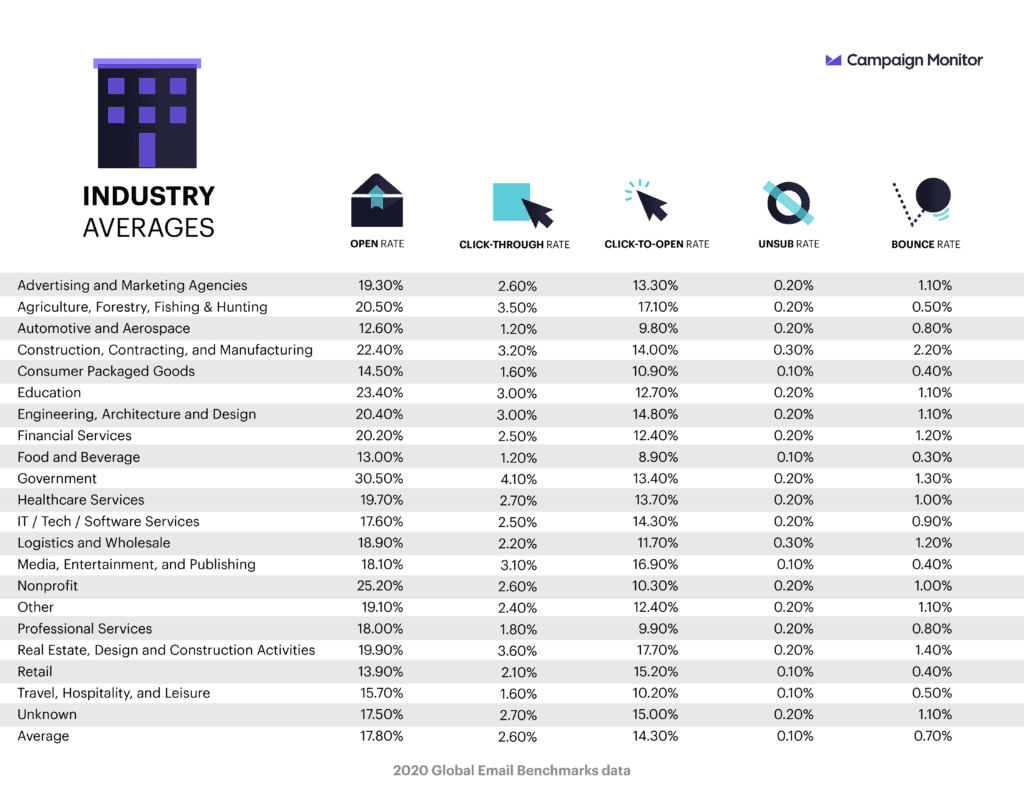
Thanks to Campaign Monitor, these are the average email benchmarks, using data from more than 30bn emails sent in 171 countries during 2019.
- Average open rate: 17.8%
- Average click-through rate: 2.6%
- Average click-to-open rate: 14.3%
- Average unsubscribe rate: 0.1%
- Average bounce rate: 0.7%
If we look at the data we can see a lot of variance by sector. For example, retail open rates, at 13.9% are way behind those from non-profits (25.2%).
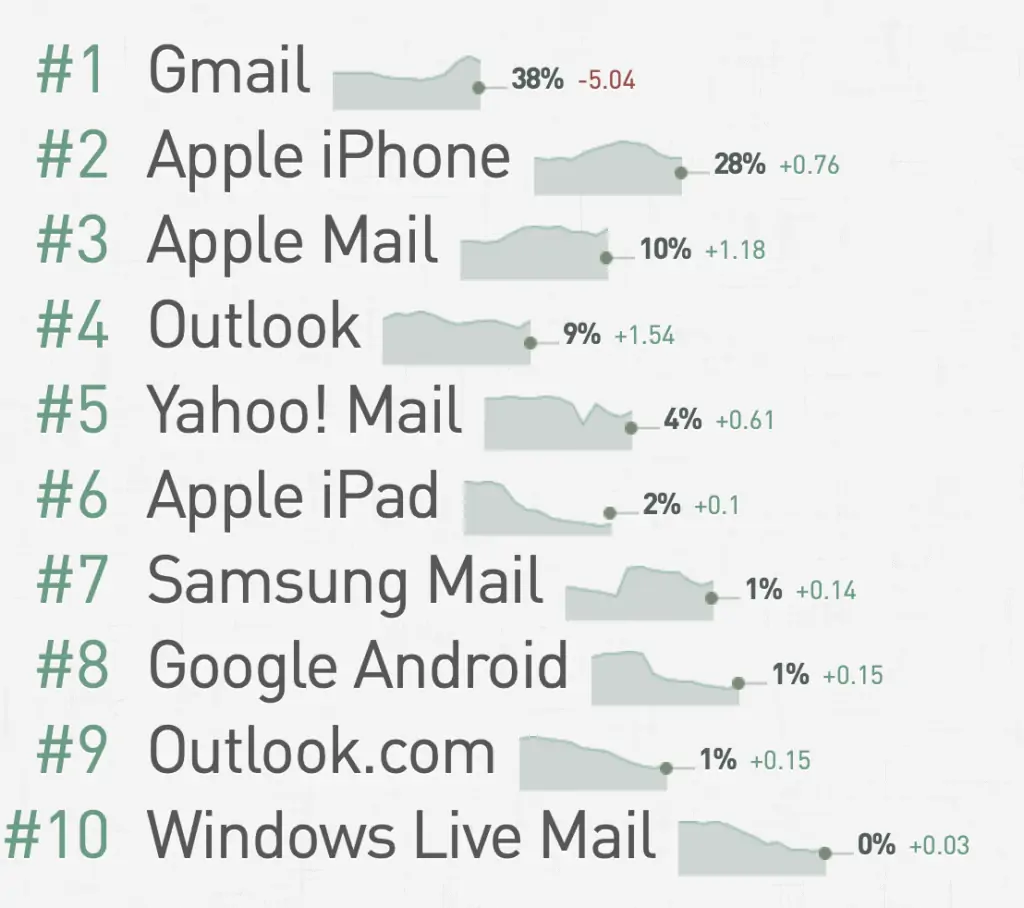
This data from Litmus shows the most popular clients people use to open emails, whether webmail, desktop or mobile. As the stats show, Gmail and iPhone dominates the market.
5. Email frequency
How many emails you send to prospects, and how often can be a source of contention. Some stress the need to avoid annoying subscribers with too much contact, while others think marketers should send as many emails as they can get away with.
The risk in sending too many emails is that customers become disengaged and begin to ignore, unsubscribe, or even report emails as spam.
On the other hand, the ‘risk’ of not sending enough emails is to miss out on potential sales from the channel.
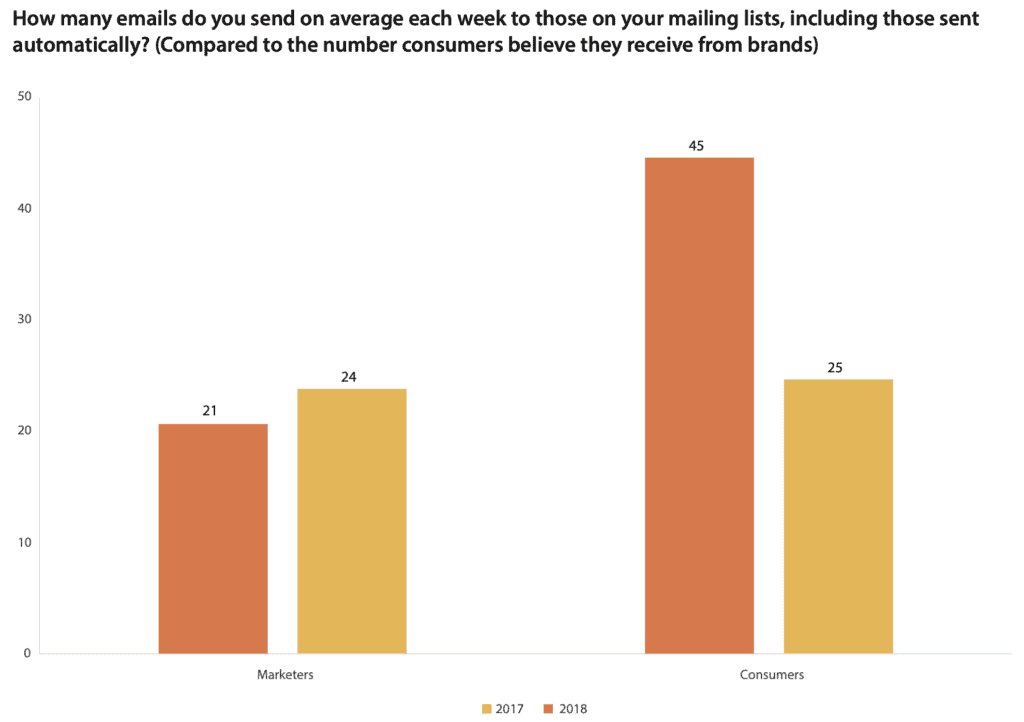
It can often be about perception. As this data from the DMA shows, consumers think they are receiving more emails (more than double) than marketers are actually sending (or think they are).
6. Key email marketing metrics used by marketers
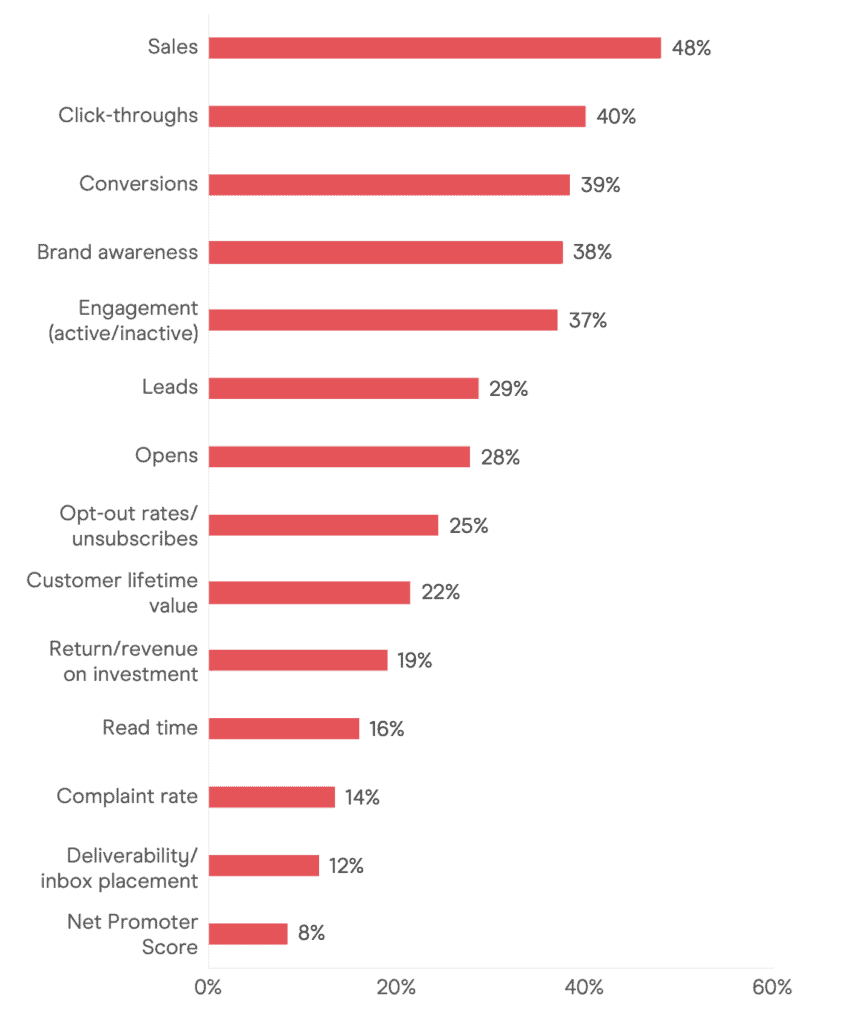
Marketers can use a wide range of metrics to measure the performance of email marketing campaigns (stats from DMA).
Sales is the key metric, with 48% of businesses focused on this metric, closely followed by CTR and conversions.
Larger organisations are more likely to track metrics like NPS and complaint rate.
7. Emails deleted without being read
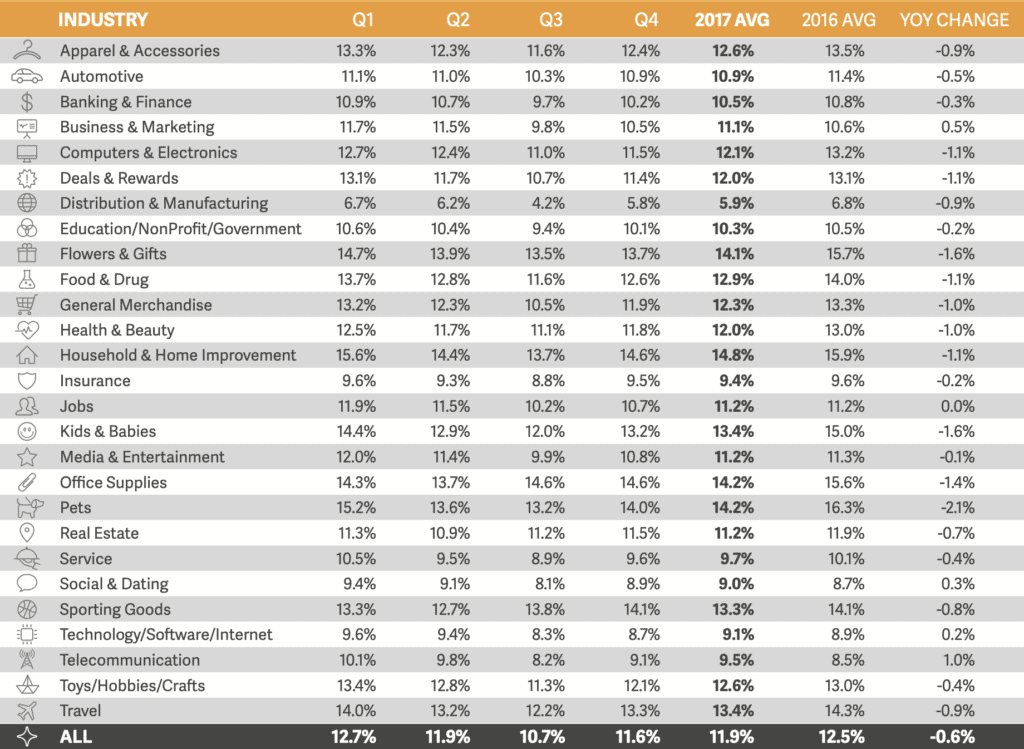
A high email deletion rate in the short term may be a sign of a failed email campaign, as it signals disinterest on the part of the subscriber.
If this continues, it can indicate issues with consent to email marketing and disinterest in your overall email marketing efforts. One to keep an eye on.
Return Path stats (the most recent I can find is 2017) show the variations between sectors.
8. How marketers encourage email signups
This chart from the DMA provides some useful insight into how marketers rate different methods for building email lists, and what attract customers to sign up.
The DMA asked marketers for the most effective ways to encourage customers to consent for emails, and consumers for the reasons why they’d sign up for a brand’s emails.
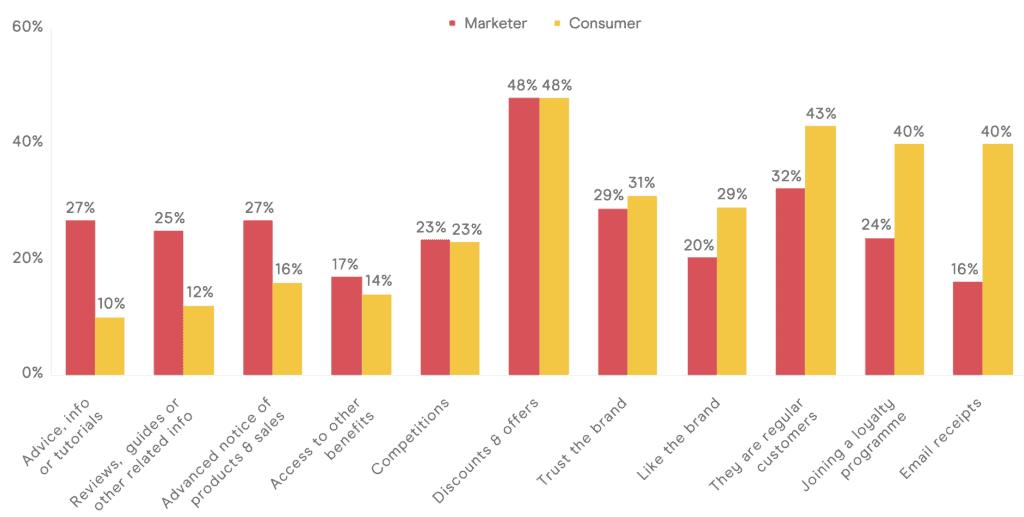
Marketers and consumers agreed that discounts and offers was the key reason for signing up.
Marketers placed more importance on the value of advance notice of products and sales and reviews and advice, while the same was true for consumers with loyalty programmes and email receipts.
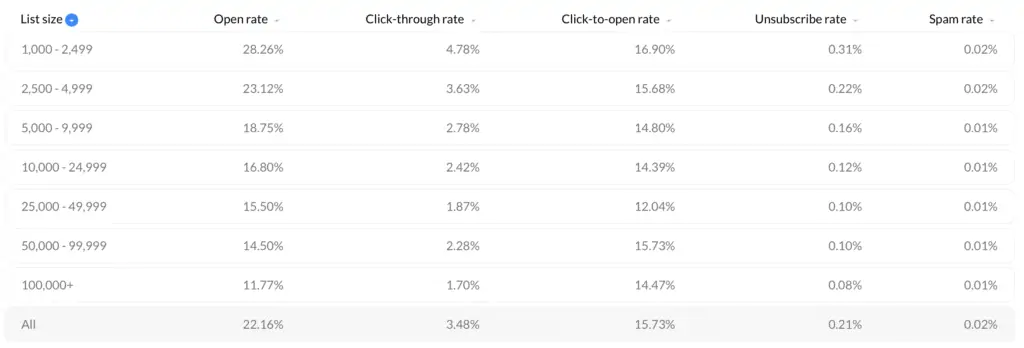
9. Email performance by list size
Stats from GetResponse suggest that, the smaller the list, the better the results achieved from email campaigns.
10. Retailer’s use of personalisation in email marketing
Data from Liveclicker/ The Relevancy Group finds that the most commonly used personalisation tactics are first name (used by 86%), email subject line (66%) and email body personalisation (62%).
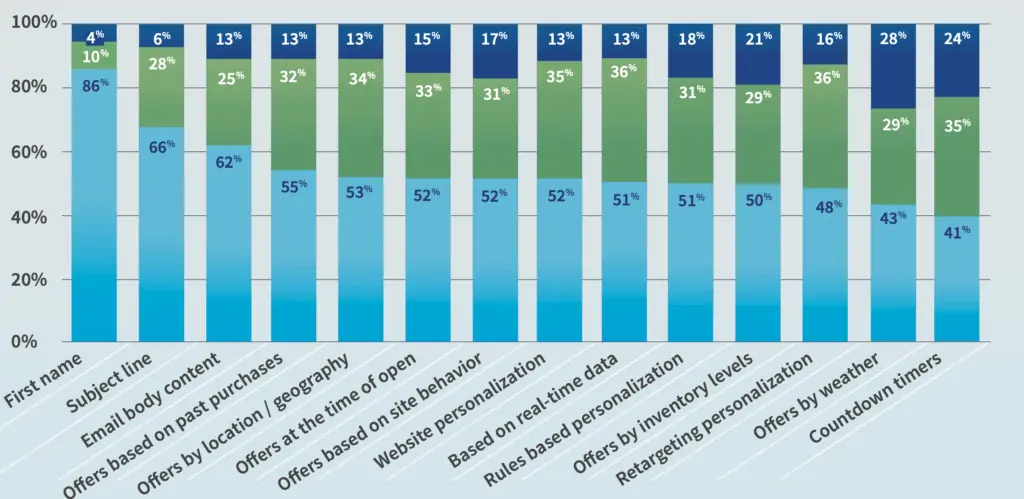
90% of the 147 retailers surveyed were using personalisation in email marketing, and the report estimates it delivers $20 for every $1 spent.
