

In some retail sectors, mobile is now the dominant channel for traffic and, in many cases, for sales also.
This collection of ecommerce statistics looks at mcommerce growth, average order values, conversion rates, and mobile payments.
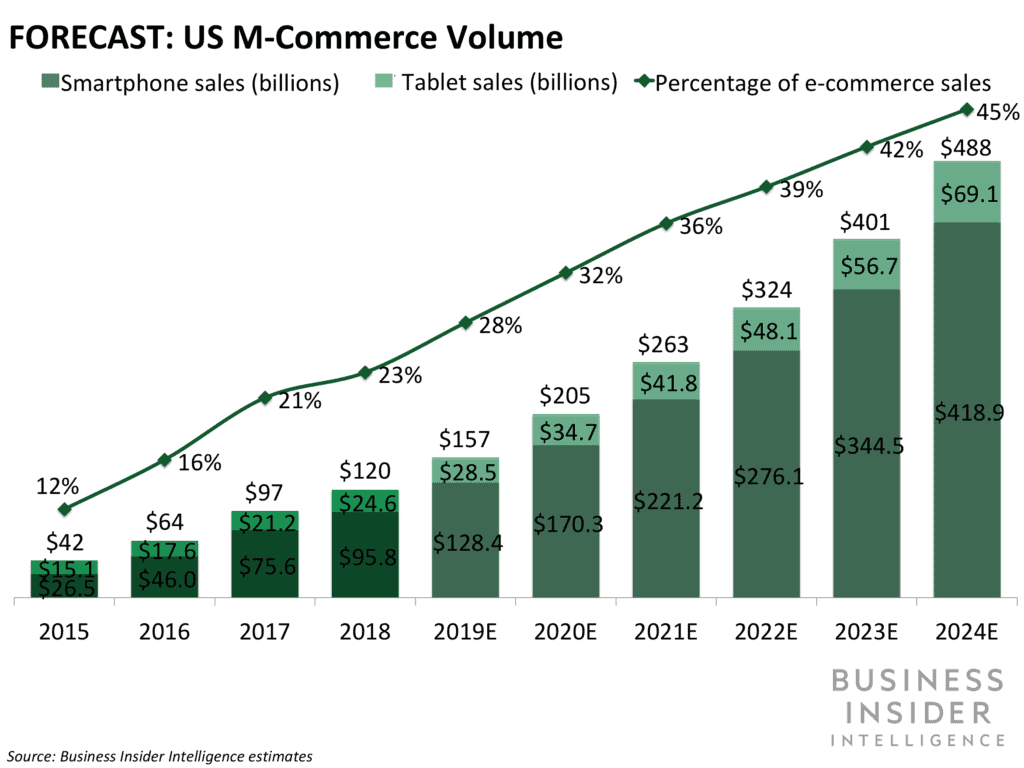
1. Mobile commerce growth: US
US m-commerce sales are predicted to reach $284 billion by 2020, which will equate to 45% of the total US ecommerce market.
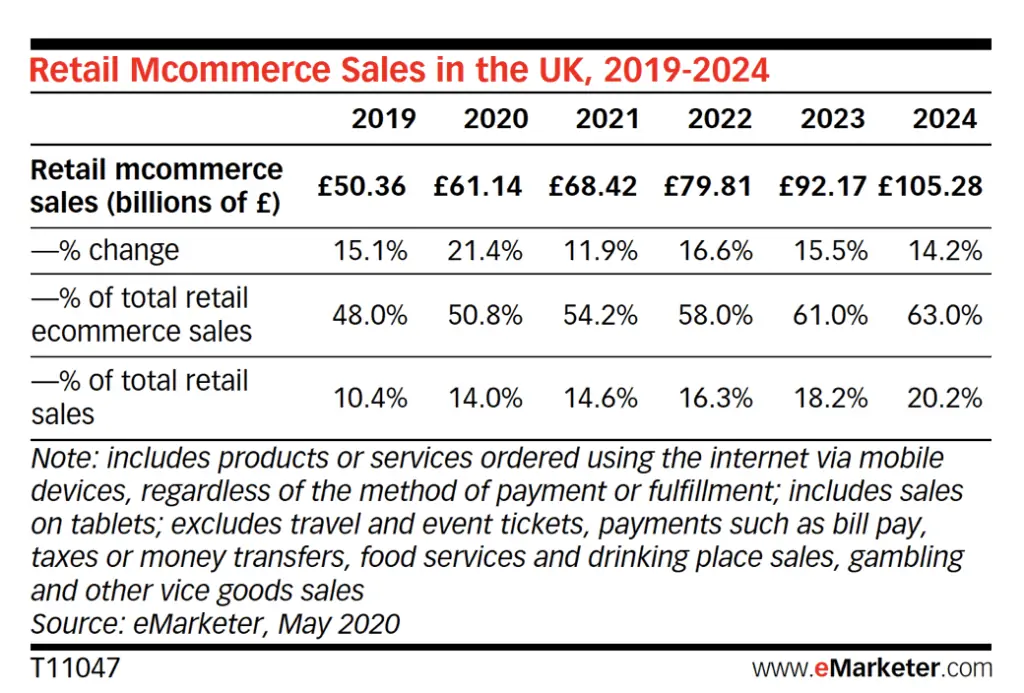
2. Mobile commerce growth: UK
The mobile commerce market is predicted to be worth £61bn in 2020 and £105bn by 2024, according to eMarketer stats.
Mobile accounted for 10.4% of all retail sales, and 48% of online sales in 2019.
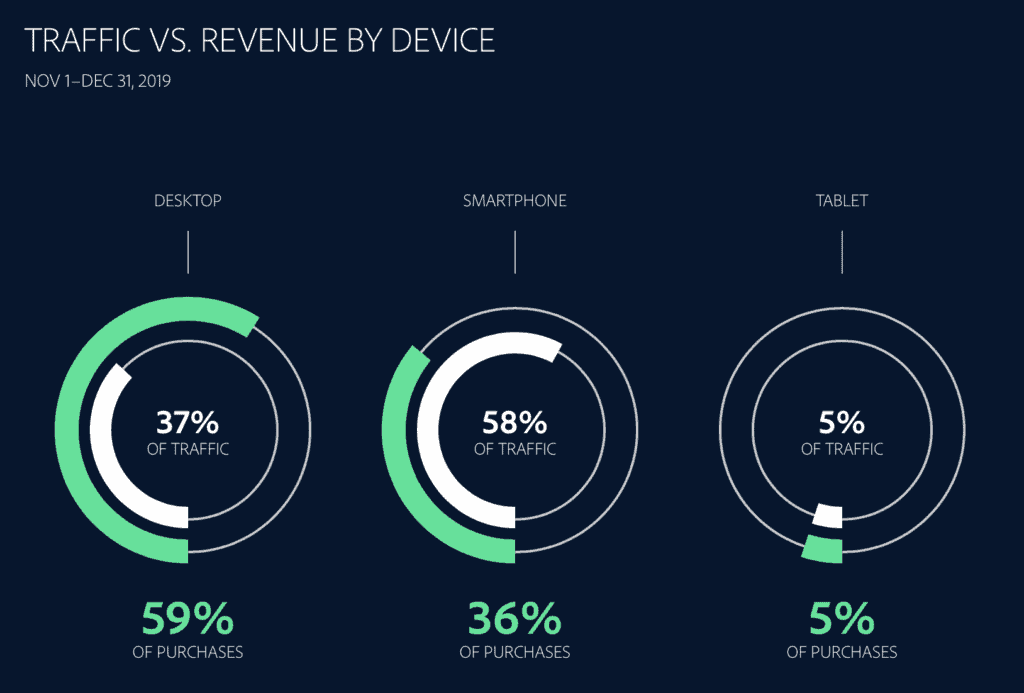
3. Traffic and sales by device
Adobe stats for the 2019 Holiday shopping season show that, though the majority of traffic to retailers came via mobile devices, the majority of sales took place on desktop.
4. Average order value for mobile, desktop and tablet
Mobile may be outpacing desktop for traffic and sales in sales but shoppers are still likely to spend more on desktop.
Desktop AOV is more than $40 higher than mobile, though tablet devices perform relatively well.
| Mobile | $128.08 |
| Desktop | $86.47 |
| Tablet | $96.88 |
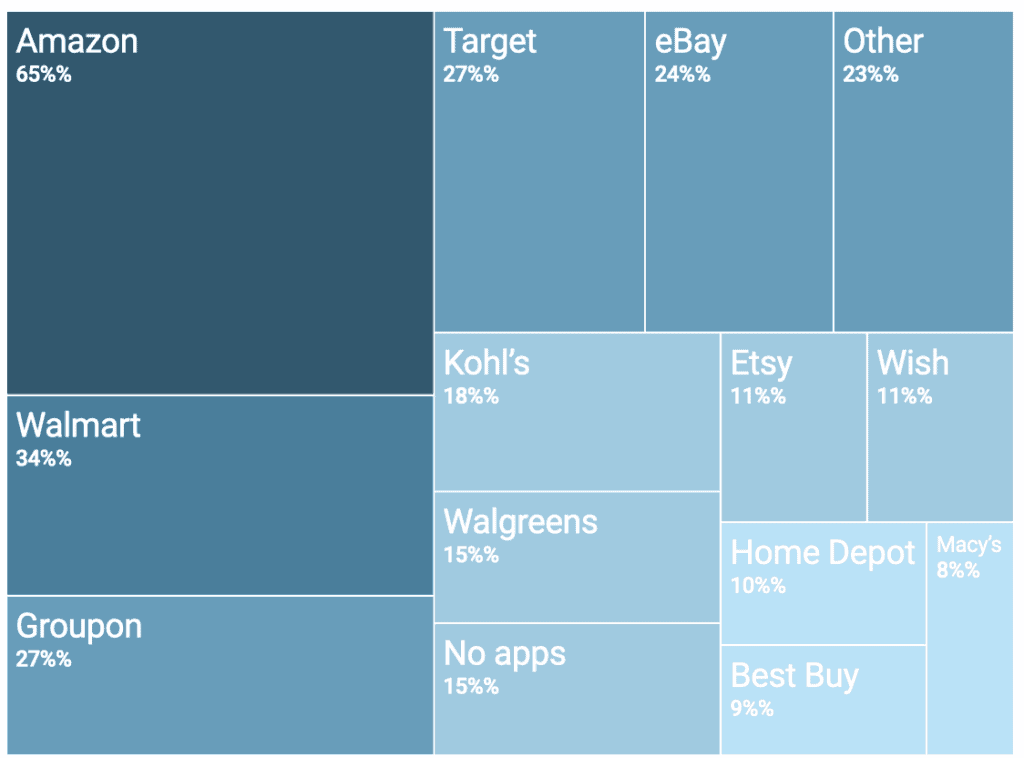
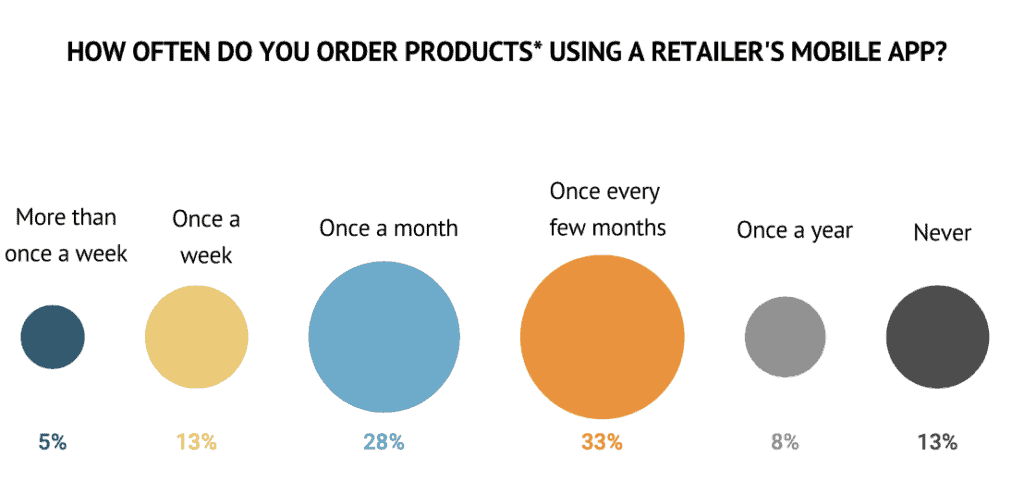
5. Mobile retail app usage
According to stats from digitalcommerce360, the majority of US shoppers have two or more retail apps installed on their mobile phones, with 18% having five or more.
The most commonly installed app is, of course Amazon, with Walmart the next on the list.
46% of shoppers order through mobile apps at least once a month, with a smaller percentage (18%) using them more regularly – once a week or more.
6. Add to cart rates for mobile, desktop and tablet
Add to cart rates (the percentage of site visitors who select and add products to their shopping basket) are relatively similar on mobile, tablet and desktop.
This suggests that, whatever the device, users are happy to browse and select items.
| Mobile | 11.87% |
| Desktop | 10.4% |
| Tablet | 12.17% |
7. Conversion rates for mobile, desktop and tablet
However, Mobile still lags behind desktop for conversion rates. This may indicate the perceived difficulty of checkout on mobile devices. Given that tablet conversion rates are very close to those of desktop, screen size may be a key factor.
| Mobile | 3.9% |
| Desktop | 1.82% |
| Tablet | 3.49% |
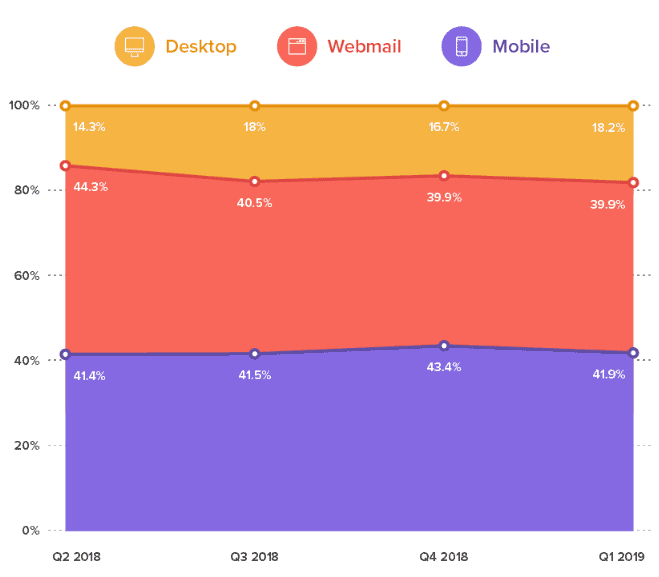
8. Percentage of emails opened on mobile devices
Stats from Litmus shows that 41% of emails are were opened on mobile devices in 2019.
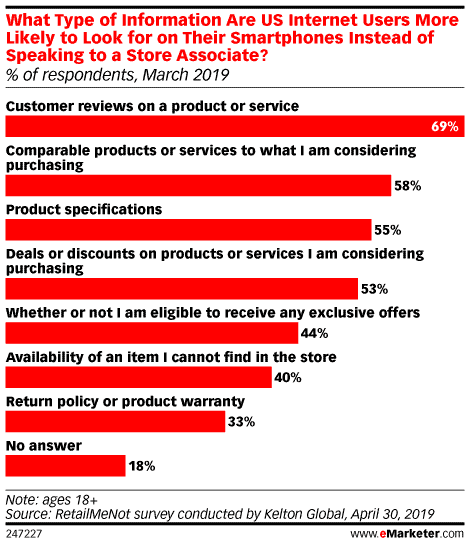
9. Use of mobile phones in retail stores
Data from eMarketer shows that most customers using mobile phones in stores are looking for customer reviews of products or service, or researching comparable products to those they’re considering in store.
According to stats from Merkleinc, 63% of Google’s US organic search traffic came via mobile in 2019.
These stats show the percentage of searches that begin on a mobile device,
| Food & Beverages | 68% |
| Automotive | 65% |
| Health & Medical | 62% |
| Sports | 62% |
| Gambling | 61% |
| News & Media | 59% |
| Lifestyle | 55% |
| Music | 55% |
| Government | 51% |
| Retail | 47% |